
Compare competitor prices when every plan meters differently
Seats, credit pools, and per-outcome fees can't share one price column. Price three buyer profiles on every competitor instead, with a worked example.

In this article
Between July 1 and September 25, 2026, nine AI-native CRM vendors made 15 changes to their prices, tiers, credit allowances, and packaging. By the end of the quarter, seven of the nine metered AI in credits, one included it in the seat, and one priced per agent.
Now picture the "price" column in your competitor sheet for that category. One cell says $89 per user. The next says $999 a month per workspace. The third says $1 per lead. They sit in the same column, and none of them answers the question you care about: what would a customer like ours pay?
This guide replaces that column with one that does answer it. You write three buyer profiles, price each one on every competitor's live pricing page, and compare what each customer would pay over a year.
Why plan against plan stopped working
The classic pricing comparison lines up plans by name or by rank: their Pro against your Pro, their cheapest paid plan against yours. That worked when everyone sold seats. A seat price times a headcount gave you a bill, and the bills were comparable.
That's no longer the market most B2B products sell into. In Growth Unhinged's 2026 monetization survey of 230 software companies, 37% ran hybrid pricing, up from 25% a year earlier, and 29% already used AI credits. Once a competitor charges for a mix of seats and usage, its plan names stop telling you its price.
Each model's bill grows with something different:
- Seats: the bill grows with headcount. Usage is free inside the seat, sometimes up to a fair-use limit.
- Seat plus a credit pool: the bill stays flat until the pool runs out, then grows with usage through overage or a plan upgrade.
- Per outcome: the bill grows with every resolved ticket, qualified lead, or completed task. It has no ceiling and no floor.
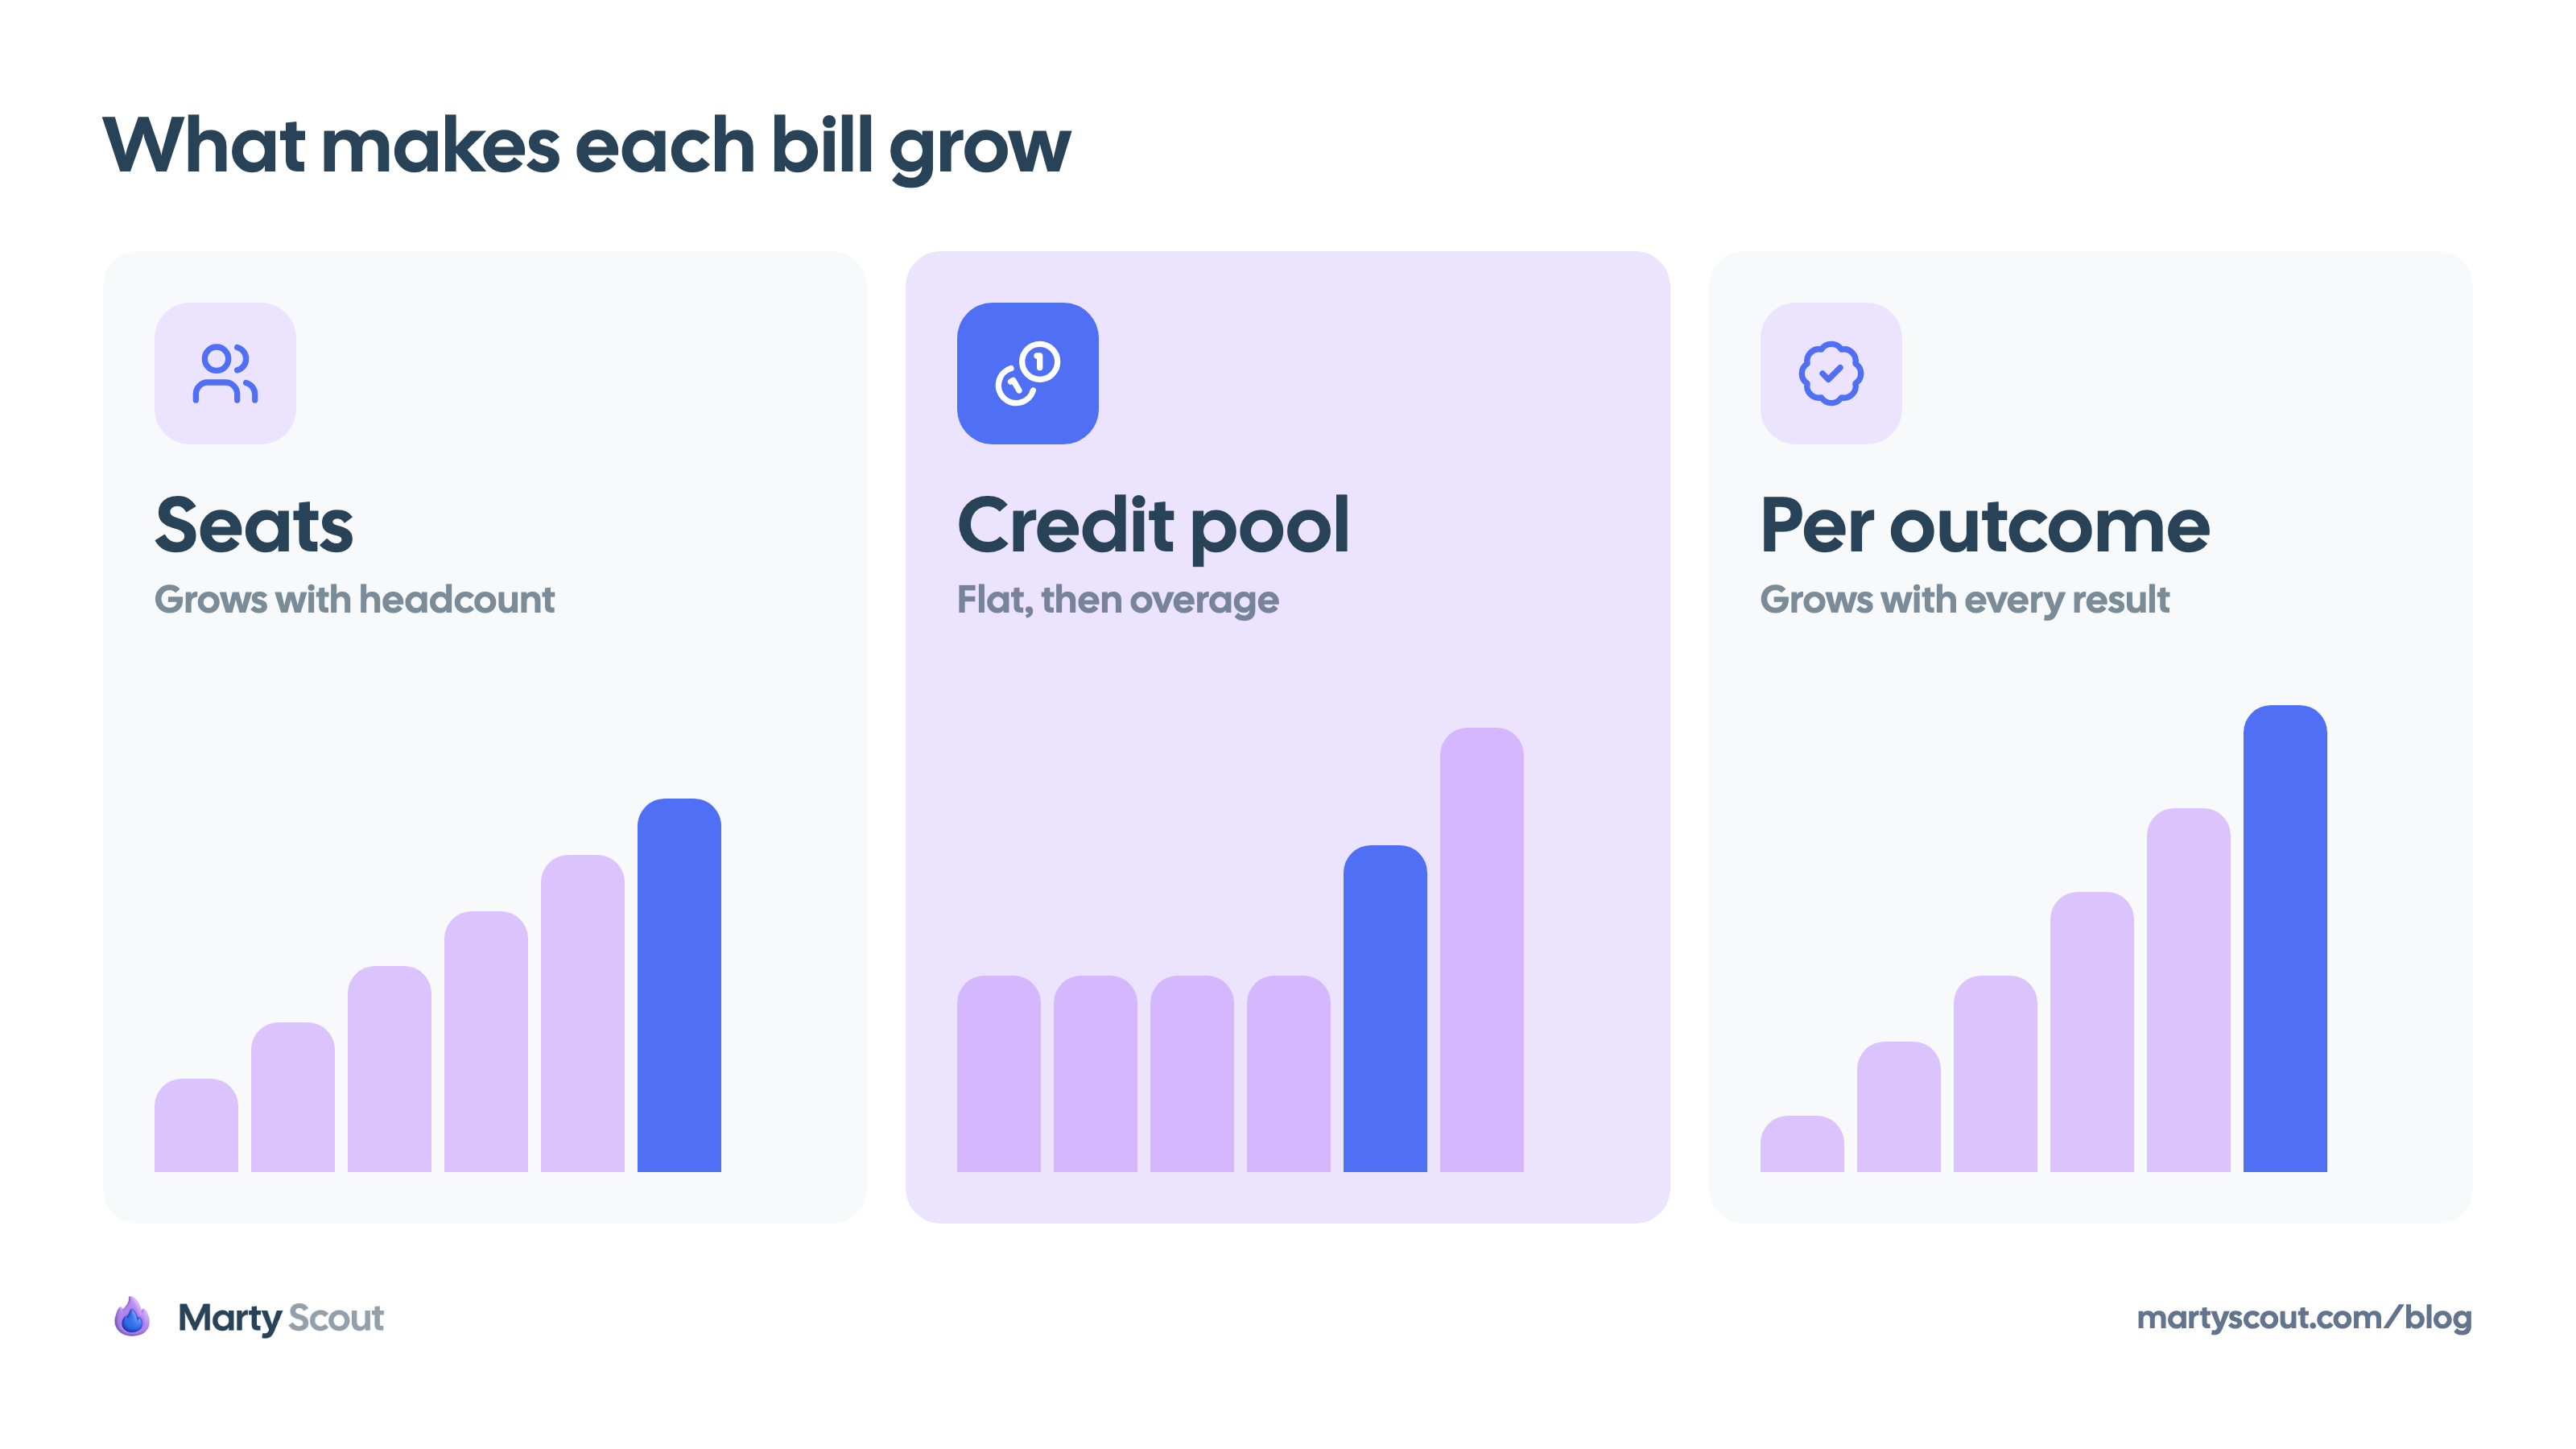
Put those three side by side and "starting price" becomes a measure of the entry ticket, not of cost. The competitor with the cheapest entry plan can be the most expensive option for your best customers, and you won't see it until you price a real customer.
Step 1: Write three buyer profiles
A buyer profile is a short description of one customer, in the units competitors charge for. Write it before you open a single pricing page, so the competitor's packaging doesn't decide what you measure.
Three profiles cover most products:
- Small team: the smallest customer you want to win.
- Growing team: your typical customer, with the features that usually force a plan upgrade.
- Heavy user: a customer who uses the metered part of the product far more than average. In an AI product, that's the team that runs agents all day.
Each profile needs the same fields:
## Profile: [name]

Paid users: [number of people who need a login]
Metered usage per month: [volume of each action competitors charge for]
Must-have features: [features that force a plan, such as SSO or audit logs]
Billing: [annual or monthly, currency]
Growth over 12 months: [users and usage a year from now]
Based on: [where these numbers come from]
Take the numbers from your own customers, not from a guess. Your billing data gives you seat counts by segment. Your product analytics gives you usage of the features competitors meter. Use the median customer in each segment, and write the source in the last line so the next person can update it.
The "must-have features" line matters more than it looks. A requirement such as SSO decides which plan a buyer can choose, and that plan sets the price. Most comparisons skip this and price everyone on the entry plan.
Step 2: Price each profile on each competitor
Now walk each competitor's pricing page as each buyer would. For every profile, find the cheapest plan that meets the must-have features, then add up a year of cost:
- The platform or workspace fee, if there is one
- Seats times the per-seat price
- Metered usage beyond what the plan includes, at the published rate
- Add-ons the profile needs, such as an SSO fee or extra credit packs
Here's a worked example with three fictional competitors and three profiles. The small team has 5 users and 2,000 AI actions a month with no SSO. The growing team has 25 users, 15,000 actions a month, and needs SSO. The heavy user has 10 users, 60,000 actions a month, and needs SSO.
- Example Co. sells seats: $30 per user a month, or $55 with SSO. AI is included in the seat.
- Sample Labs sells workspaces with unlimited seats: $400 a month with 240,000 credits a year, or $900 a month with SSO and 600,000 credits. Each AI action costs one credit, and overage is $0.02 per credit.
- Mockline sells cheap seats and meters AI: $15 per user a month, $0.05 per AI action, and SSO as a $200 monthly add-on.
| Competitor (fictional) | Small team | Growing team | Heavy user |
|---|---|---|---|
| Example Co. | $1,800 | $16,500 | $6,600 |
| Sample Labs | $4,800 | $10,800 | $13,200 |
| Mockline | $2,100 | $15,900 | $40,200 |
Mockline has the lowest entry price on the page, and it's the cheapest option for none of the three profiles. Example Co. wins the small team and, because AI is inside the seat, the heavy user. Sample Labs wins the growing team because its unlimited seats beat any per-seat price at 25 users.
Record each result as its own row in your competitor benchmark log, with a definition such as "Annual cost for the growing team profile, annual billing, USD", the pricing page as the source, and the date you checked. The math goes in a note, so anyone can redo it.
Where the credit math hides the real cost
The pricing page gives you the rate. It rarely gives you the full cost, and the gap is widest in credit and outcome pricing. Four traps show up again and again.
The pool is per org, not per user
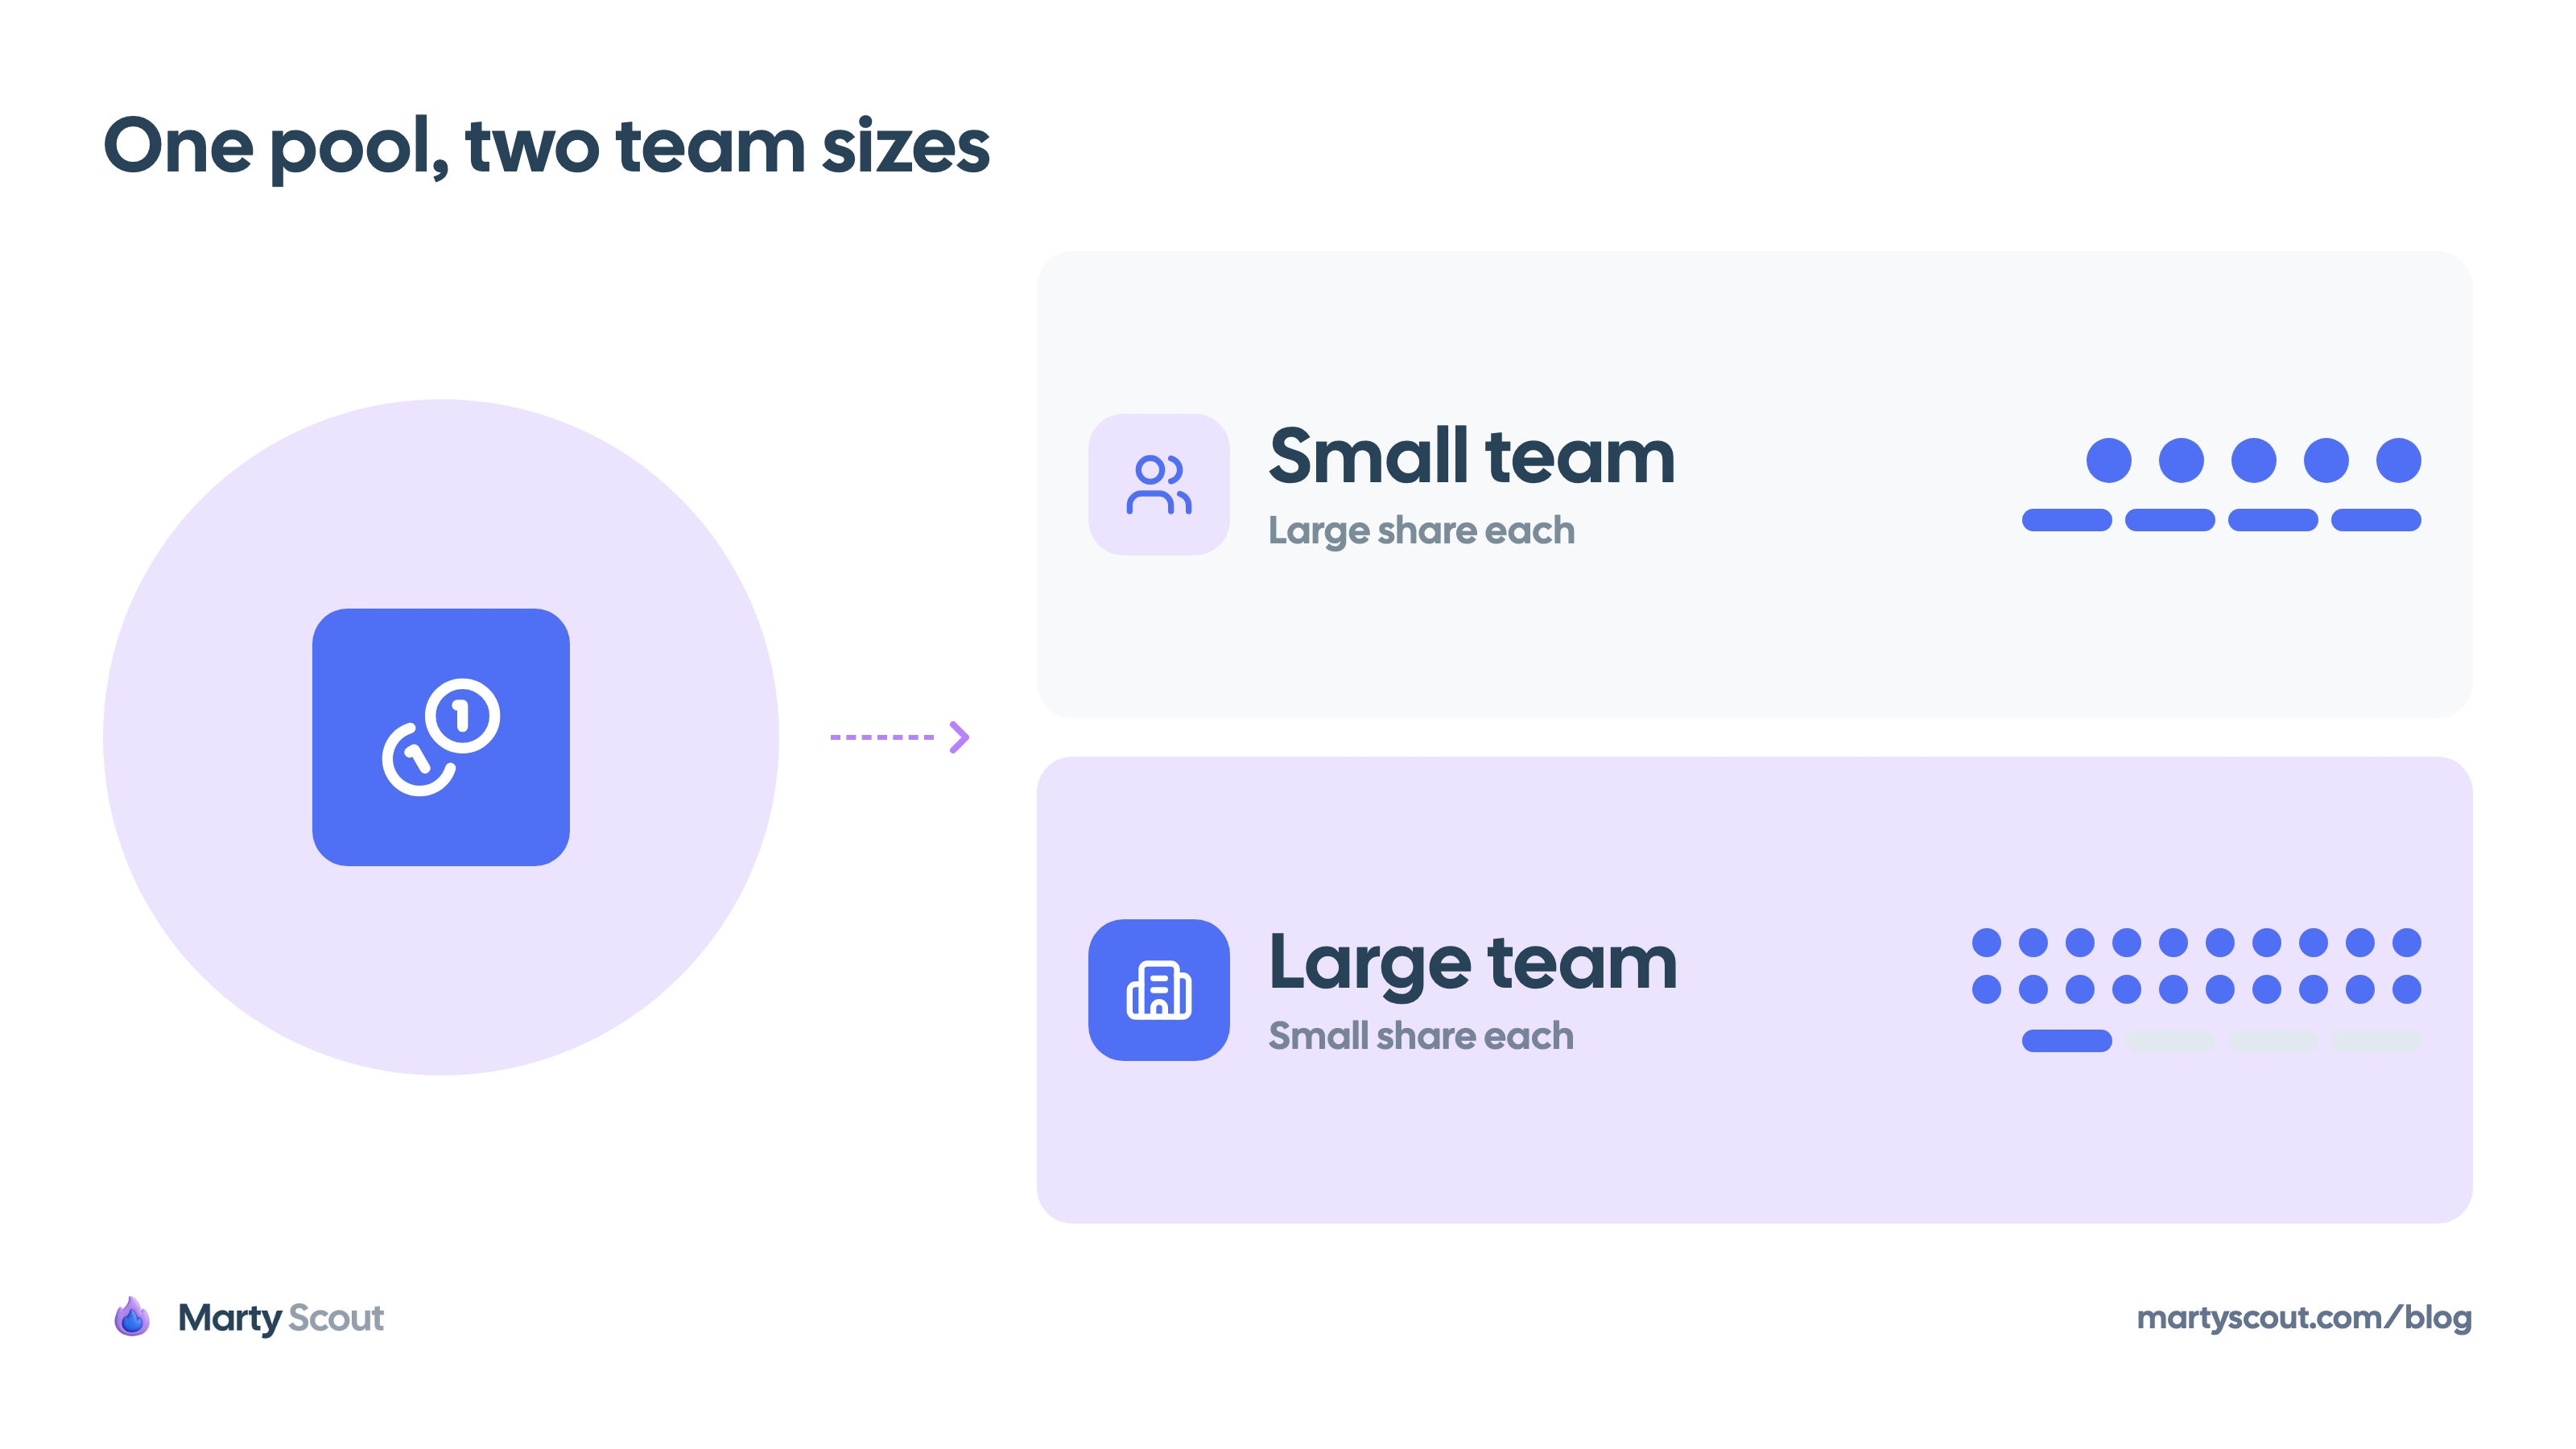
Credit pools often belong to the whole account. Salesforce's Sales Cloud editions, relaunched on September 3, 2026, come with 500,000, 1 million, or 2.75 million Flex Credits a year per org, not per seat. Supered's reading: on the Core edition, a 20-rep team gets about five actions per rep per working day.
So the pool that looks generous for a five-person team is thin for a team of fifty. Price it for every profile, never once for the whole company.
A per-outcome bill grows as the product improves
Outcome pricing sounds safe for the buyer: you pay only when it works. But the better it works, the more you pay. SaaStr's math on HubSpot's per-resolution pricing: 5,000 support conversations a month at $0.50 per resolution costs $1,625 at a 65% resolution rate and $2,250 at 90%.
When you price a per-outcome competitor, run the profile at today's success rate and at a higher one. The second number is the bill their customer will see after a year of the vendor tuning its model.
Not every action costs the same
A credit is a unit, not a price, and actions don't all cost the same. In the same Supered breakdown, Salesforce's Flex Credits come to $0.10 for a standard action and $0.15 for a voice action. Find the vendor's rate card, usually in the documentation and not on the pricing page, and price each profile's actions at their own rates.
Published rates disappear
Lightfield published per-credit rates and annual allowances on August 14, then went back to seats on September 17 and withdrew the rates from its pricing page. When a rate isn't public, don't fill the cell with an estimate. Write "unknown: not public" and look for the number in lost-deal quotes instead.
Step 3: Read the spread, not the cheapest line
The table isn't a ranking. Its value is in the pattern across columns, and three readings come out of it.
First, find where you're the most expensive. The profile where you price highest is where you should expect to lose deals on price. Check it against your own losses before acting: if those deals come from the heavy-user segment, the table explains them.
Second, read each competitor's model as a statement about its target customer. A vendor that puts AI inside the seat is betting on customers who use it heavily, or betting that AI costs will fall. A vendor with unlimited seats and a credit pool wants growing teams and expects to earn on usage. You learn who they're built for without a single interview.
Third, look at the gap as well as the order. If two competitors are 5% apart for a profile, price isn't what decides that deal. If one is three times the others, it will come up in every conversation with that buyer.
Step 4: Rerun it when a meter changes
A profile comparison goes stale faster than a seat comparison, because there are more numbers to change. A seat vendor changes one price. A credit vendor can change the allowance, the rate, the credit cost per action, or the model itself, and Lightfield did several of those in one quarter.
Rerun the affected column whenever a competitor changes its value metric, its allowance, or a rate on its rate card. Catching those changes is its own routine, covered in how to track competitor pricing changes. A page-change monitor or an agent such as Marty Scout, which tracks competitor pricing changes, can flag the page so you rerun only the column that moved.
Rerun the profiles themselves once a year, or when your own customer mix shifts. If your typical customer grows from 25 users to 60, the growing team profile is out of date, and so is every number priced against it.
Price one profile this week
Start with the growing team profile, because it's your typical customer. Fill in the six fields from your own billing data, then price it on the competitor you meet most often in deals.
That single number tells you more than the full grid of plan prices you have today. Add the other two profiles and the next two competitors once the first one is done.
FAQ
How do you compare SaaS pricing when competitors use different pricing models?
Stop comparing plans and compare what a specific customer would pay. Write two or three buyer profiles with seats, usage, and must-have features, then calculate a year of cost for each profile on each competitor's published pricing. The result is comparable even when one competitor sells seats and another sells credits.
How do you benchmark your pricing against competitors?
Price the same buyer profiles on your own pricing page and on each competitor's, then compare the annual cost per profile. Look for the profile where you're most expensive and check it against deals you lost on price. A benchmark of list prices alone misses packaging, usage fees, and discounts.
How many competitors should a pricing comparison include?
Three to five, chosen from the competitors you meet most often in deals. Each competitor adds one column for every profile, and each value has to be rechecked when that competitor changes its pricing. A larger set goes stale before anyone uses it.
How do you estimate a competitor's credit consumption from outside?
Use your own product usage as the proxy: count how often your customers perform the actions the competitor charges credits for. Then price those actions at the competitor's published credit cost per action, which usually sits in its documentation. If the rates aren't public, mark the value as unknown instead of guessing.
Should your price match the average of your competitors?
No. The average of three different pricing models describes no real customer. Decide which buyer profiles you want to win, and make sure your price is competitive for those profiles, even if you're the most expensive option for a segment you don't target.
Related articles
How to track competitor pricing changes before they cost you
A five-step routine for catching packaging moves, new limits, and plan renames on a competitor's pricing page, and for deciding which ones deserve a response.
Competitor analysis and benchmark templates that decide
Two copy-ready worksheets: one competitor and one question, or one metric across several. Every cell carries a source, a date, or an honest blank.
Match market research tools to the decision in front of you
Three jobs hide inside every top market research tools list: paid respondents, public landscape sources, and competitor monitoring. Pick one per decision.